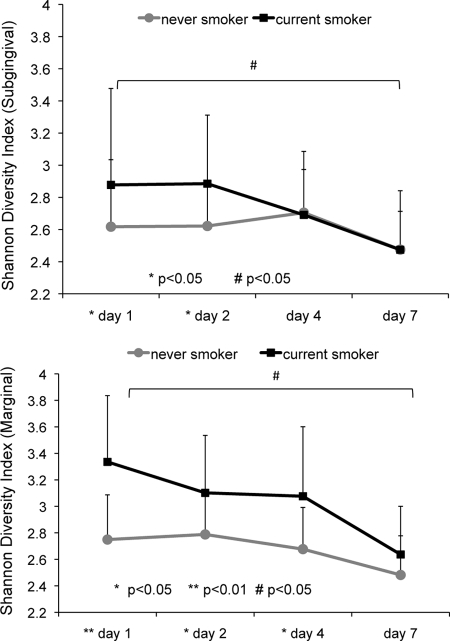
Fig. 2.
Shannon diversity index over 7 days in current smokers and nonsmokers. Results for subgingival biofilm are shown in the upper panel and those for marginal biofilm in the lower panel. Smokers demonstrated a decrease in diversity over 7 days (#, P < 0.05 by repeated-measures ANOVA) and showed a greater diversity than nonsmokers (*, P < 0.05; **, P < 0.01).

