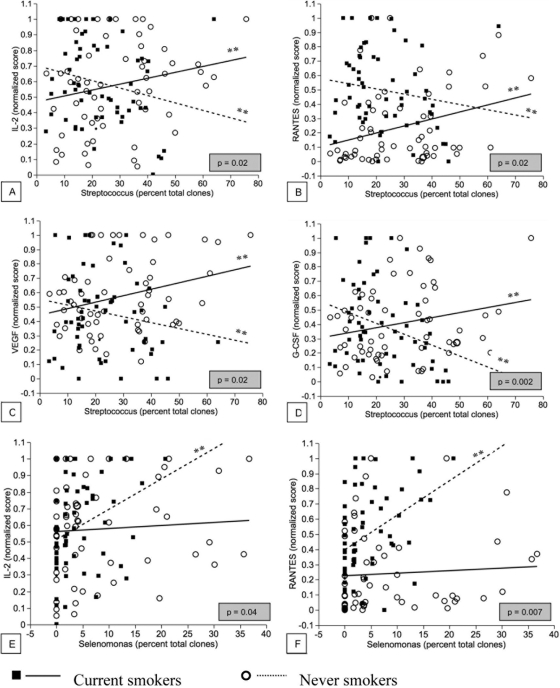
Fig. 6.
Best linear fits for coassociation between subgingival genera and inflammatory cytokines in current smokers and nonsmokers. P values highlighted in gray correspond to the null hypothesis that the two slopes are the same. P values corresponding to the null hypothesis that each slope is zero are also shown (*, P < 0.05; **, P < 0.01).

