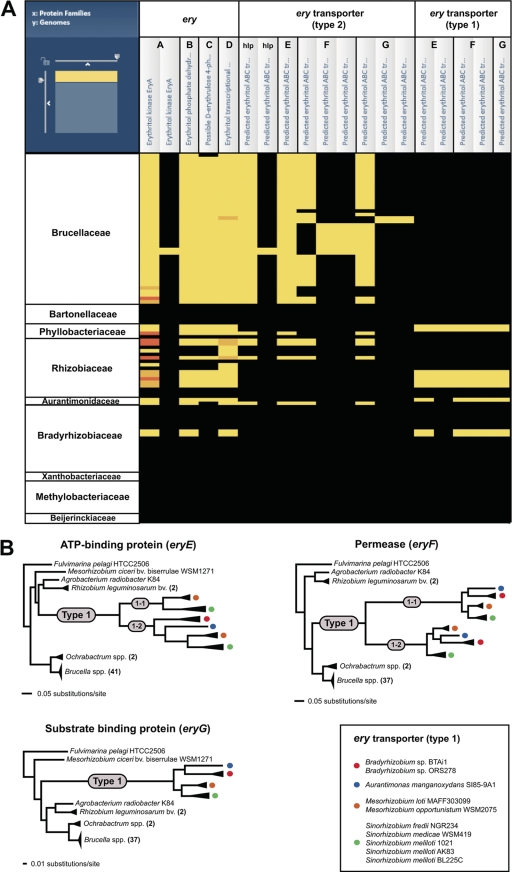
Fig. 3.
Phylogenomic analysis of erythritol catabolic and transport genes across 107 Rhizobiales genomes. These results summarize the comparative genomics experimental design, which primarily utilizes the PATRIC Protein Family Sorter (PFS) tool (Fig.2). (A) Heat map depiction of the distribution of erythritol catabolic (eryA-D) and transport (hypothetical lipoprotein [hlp] and eryE-G) proteins. The x axis of the map lists the annotated Ery protein families (simplified at top), with individual components (including duplications and split CDSs) enclosed within black boxes. The y axis shows the genomes, with taxon names simplified and arranged at the family level. Black regions indicate no representative proteins assigned to the protein family; bright yellow regions indicate one representative protein assigned to the protein family. Other colors depict multiple representatives per protein family, with increasing membership ranging from dark yellow to dark orange. (B) Phylogenetic analysis of the type 2 and type 1 ery transport proteins. Alignments, performed using MUSCLE v3.6 (17, 18), and generated trees, estimated using FastTree v.2 (34), were visualized simultaneously using the PATRIC Multiple Sequence Alignment Viewer (see Fig. S2C in the supplemental material). The phylograms for EryE, EryF, and EryG are simplifications of the larger trees and depict the evolution of type 1 transporter components from the type 2 family. Smaller gray circles illustrate the duplication of the type 1 components into type 1-1 and type 1-2 (EryE and EryF only). All taxa encoding type 1 components are represented with colored circles, which are explained in the inset at bottom right.

