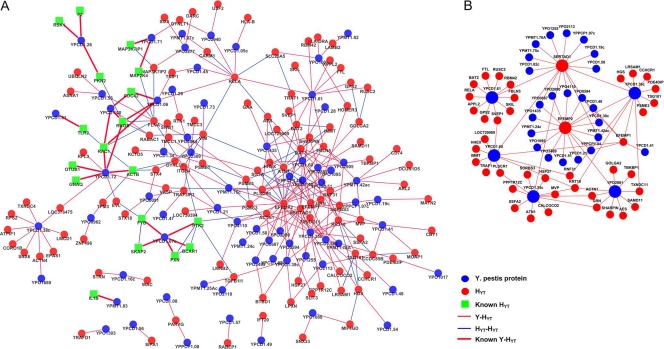
Fig. 2.
Graphical view of the YHPI network. (A) Graph of the YHPI network by combining the interactions identified in the present Y2H study with the 23 published interactions between Y. pestis and human proteins. (B) Graph of interactions involving high-degree nodes in the YHPI network, including both Y. pestis proteins and HYTs that interact with multiple HYTs and multiple Y. pestis proteins. Blue and red circles represent Y. pestis proteins and HYTs, respectively. Green squares represent known HYTs. Red lines represent interactions between Y. pestis and HYTs, and bold red lines represent the previously published interactions. Blue lines represent interactions between HYTs. The larger nodes are proteins that interact with over 10 partners.

