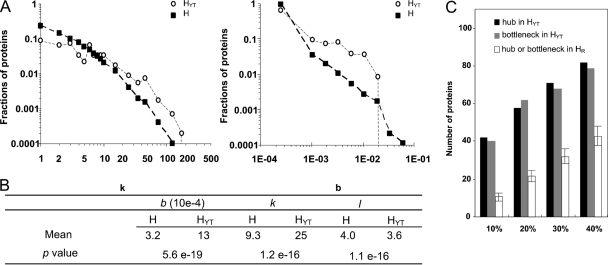
Fig. 3.
Topological analysis of the YHPI network. (A) Log-log distributions of degree and betweenness for H and HYTs in the H-H PPI network. (B) Averages of degree (k), betweenness (b), and shortest path length (l) for all human proteins (H) and for HYTs integrated in the H-H PPI network. The Mann-Whitney U test was used to test the significance of the differences in k, b, and l between H and HYTs. (C) Comparison of the numbers of hubs or bottlenecks in HYTs with those in HR, which represents the data set generated by random sampling of H from the H-H interaction network. The x axis indicates the cutoffs for the classification of a protein as a hub protein or as a bottleneck protein (10%, 20%, 30%, or 40%), and the y axis indicates the number of hub or bottleneck proteins in the indicated data sets. The average number of hub or bottleneck proteins in 1,000 HR data sets is shown with the standard deviations.

