Fig. 1.
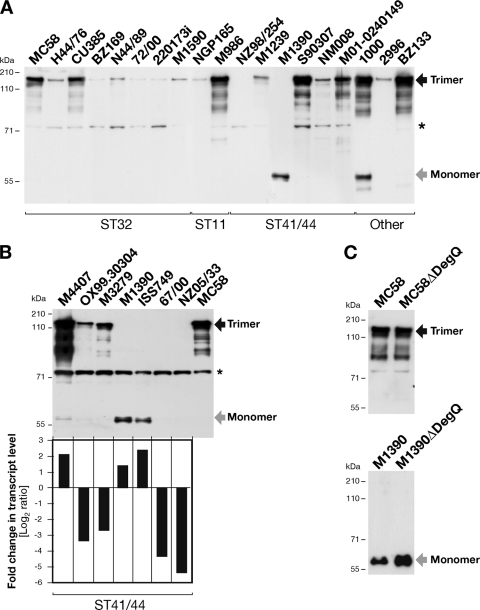
(A) Analysis of NhhA production in a panel of N. meningitidis serogroup B strains. Western blot analysis under denaturing conditions of whole-cell lysates showing the variation in protein production levels among different clinical isolates is presented. A subpanel of the strains tested is shown. The results for all the strains tested are reported in Table 1. (B) Comparison of NhhA production and nhhA transcript levels in a subset of ST41/44 N. meningitidis serogroup B strains. (Top) Western blot analysis of whole-cell lysates under denaturing conditions. Western blot analysis was performed using a polyclonal mouse serum raised against recombinant NhhA-His protein (N. meningitidis serogroup B strain 2996). (Bottom) Quantitative analysis of nhhA transcript levels analyzed by relative qRT-PCR. Both nhhA and the control gene were amplified from the same amount of total RNA, and the data are presented as fold change in nhhA mRNA after normalization to 16S rRNA expression levels, using MC58 as a reference strain, which is reported as a log2 value of 0. (C) Effect of DegQ on trimerization and detection of NhhA protein. Deletion mutants of DegQ in MC58 and M1390 were analyzed for the expression of NhhA in whole-cell lysates. NhhA trimer bands are observed at ∼180 kDa (black arrow) and monomer bands at ∼60 kDa (gray arrow). The asterisks mark a nonspecific cross-reactive band.

