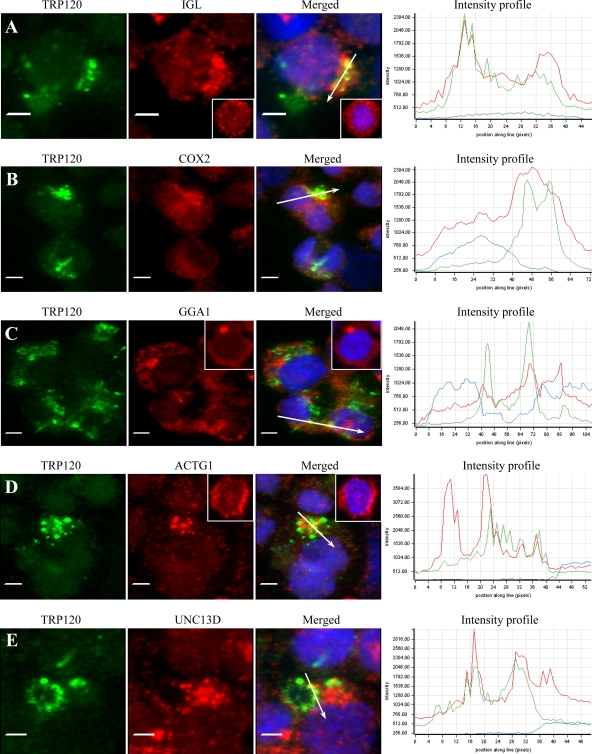
Fig. 6.
Colocalization of IGL, COX2, GGA1, ACTG1, and UNC13D with E. chaffeensis TRP120 in E. chaffeensis-infected THP-1 cells. Fluorescence microscopy and intensity profiles of infected THP-1 cells stained with 4,6′-diamidino-2-phenylindole (blue), anti-TRP120 (green), and anti-IGL, -COX2, -GGA1, -ACTG1, or -UNC13D antibodies (red; A to E, respectively) show colocalization of E. chaffeensis TRP120-labeled morulae with IGL, COX2, GGA1, ACTG1, and UNC13D (A to E). The white arrows in the fluorescence images indicate the areas selected for fluorescence intensity profile analyses, which are displayed in graph form. The x axis shows the position along the line (pixels), and the y axis shows the fluorescence intensity. The insets (A, C, and D) show the distribution of IGL, GGA1, and ACTG1 in normal uninfected THP-1 cells. Bars, 5 μm.

