
Fig. 2.
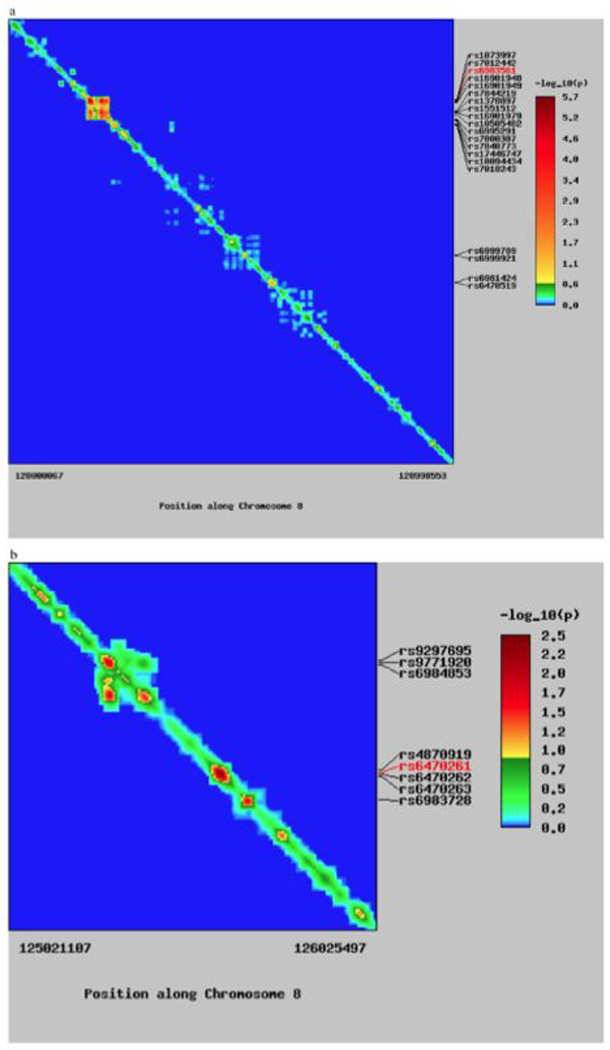
Heat map for association and LD on chromosome 8q24. (a) Heat map for the 8q24 region. Chromosomal position is labeled on the bottom. SNPs with strong association signals are identified to the right of the figure, with the strongest signal labeled in red. Both the rows and columns represent individual SNPs. Colors in the matrix represent the strength of the association signal for the SNP in that row. On the diagonal, the association signal is simply the observed value for that particular SNP. Off-diagonal elements represent the expected association signal for the SNP in that row due to its correlation with the SNP in the corresponding column. (b) View of additional 8q24 loci illustrating an asymmetric association pattern. SNP, single nucleotide polymorphism.