
Fig. 4.
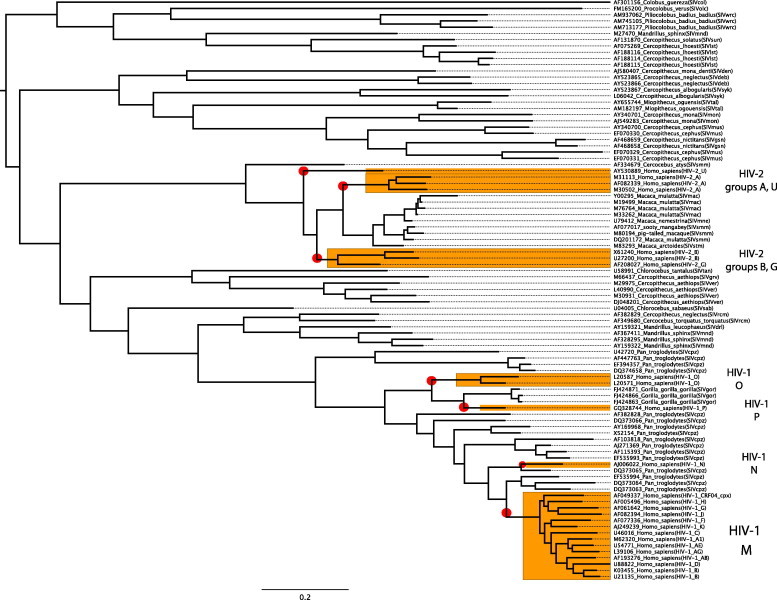
Phylogenetic tree showing HIV cross-species transmission. The tree was built using 93 pol gene amino acid sequences from Los Alamos database and the Bayesian approach implemented in MrBayes 3.1.2. Taxon names represent accession number, host species name and isolate designation. A red circle highlights potential cross-species transmissions. Representative sequences from HIV-1 and 2 types are also shown. The scale bar denotes amino acid changes as substitutions per site. (For interpretation of the references to color in this figure legend, the reader is referred to the web version of this article.)