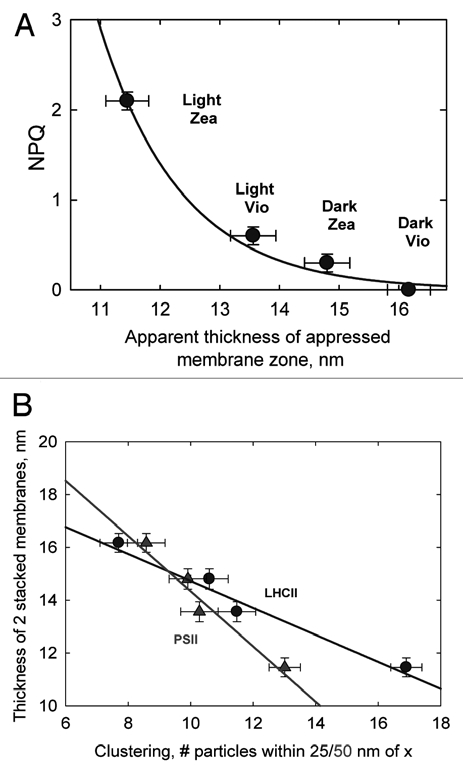
Figure 3.

(A) Relationship between apparent thickness of appressed membrane zone and NPQ amplitude in Dark Vio, Light Vio, Dark Zea and Light Zea intact spinach chloroplasts. (B) Relationships between PSII (triangles) and LHCII (circles) particle clustering in freeze-fracture electron micrographs reported in Johnson et al.1 and the thickness of thickness of appressed membrane zone.
