Fig. 2.
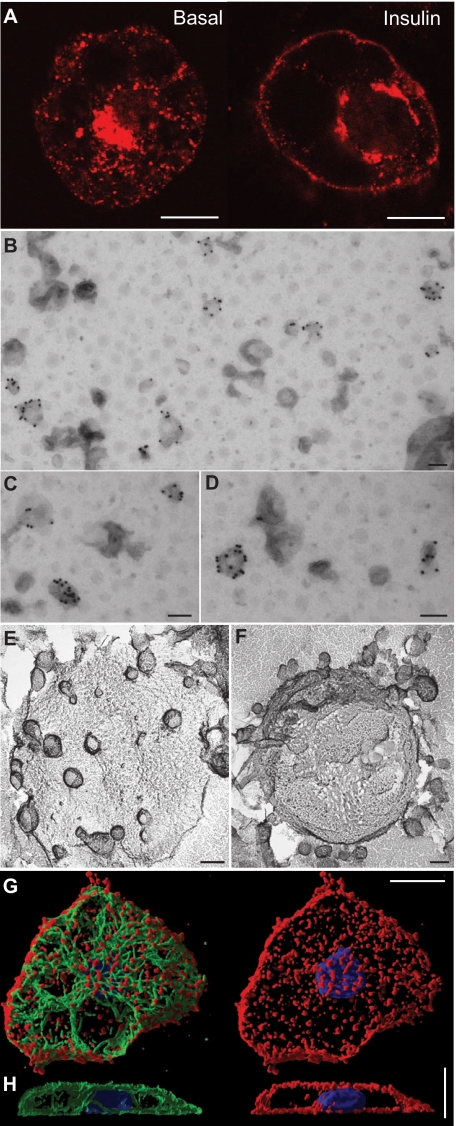
Imaging GLUT4 and the cytoskeleton in adipocytes. (A) Immunofluorescence image of untreated (left) or insulin-stimulated (right) 3T3-L1 adipocytes that were immunolabelled for endogenous GLUT4. (B–D) Immuno-EM of GLUT4 in vesicles that were prepared from non-stimulated rat adipocytes. After adsorption to EM grids the vesicles were labelled with an antibody against GLUT4, followed by protein-A–gold (10 nm). The size of GLUT4 vesicles in B ranges from 63 to 135 nm. Images were taken by Sally Martin [see Martin et al. (Martin et al., 1997) for methodological details]. (E,F) Deep-etch images of GLUT4 vesicles immunopurified using Staphylococcus aureus cells coated with an anti-GLUT4 antibody then incubated with an adipocyte microsomal fraction. Non-GLUT4-containing vesicles were washed away. Consistent with B–D, the majority of vesicles are small (~50–70 nm) but a population of larger vesicles was also detected. Images were taken by John Heuser using a published method (Rodnick et al., 1992). (G,H) 3D shadow renderings of 120 confocal z-sections (Imaris, Bitplane) of an untreated 3T3-L1 adipocyte. Tubulin (stained with an anti-tubulin antibody) is shown in green, F-actin (stained with TRITC–phalloidin) is shown in red and the nucleus (labelled with DAPI) is shown in blue. Viewed from the top (G) or from the side (H). Scale bars: 10 μm (A,G,H) and 100 nm (B–F).

