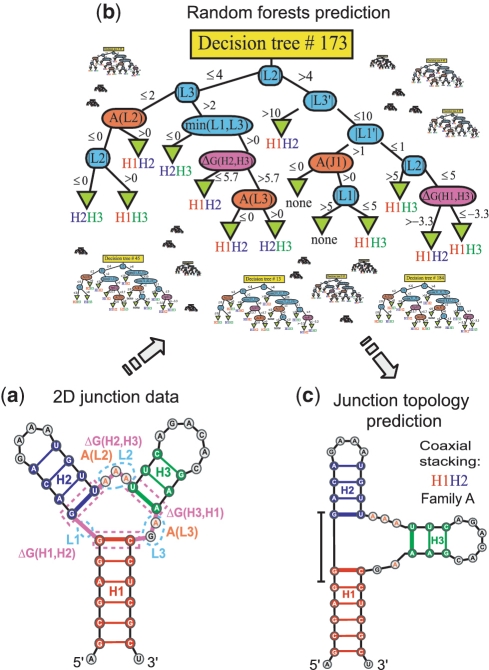
Figure 3.
Sequence and loop length information from junctions is defined on the basis of secondary structure (a), to predict, by the random forests approach (b), the coaxial stacking as well as the junction family type (c). Color coding and symbols in the decision tree are defined as follows. Loop length features (|Li|, min(|L1|,|L2|), |L1′|) in blue, maximum number of consecutive adenines in loop (A(Li)) in orange, and free-energy associated with a pair of helices (ΔG(Hi,Hi+1), with i = 1, number of helices) in magenta (Table 1).

