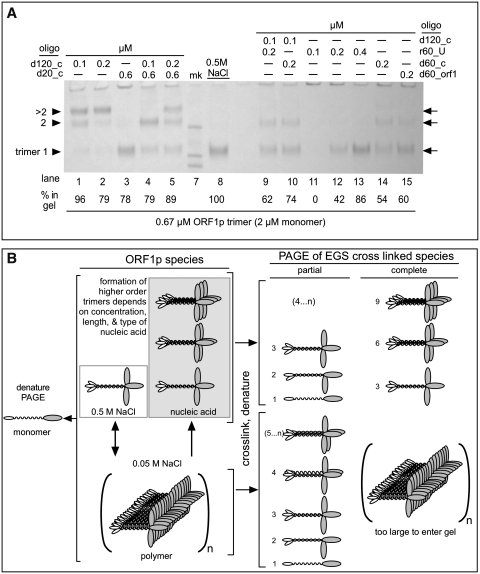
Figure 3.
ORF1p polymers—effect of oligonucleotide length and concentration. (A) Cross-linking with 1 mM EGS was carried out as described in the ‘Materials and Methods’ section and all of the oligonucleotide-containing reactions were at 0.05 M NaCl. The arrows indicate the position of the trimer, and higher multiples thereof, i.e. trimer2, >timer2, the latter of which we presume is a trimer of the ORF1p trimer. While the mobility of the trimer band corresponds to its expected molecular (127 kDa), the higher trimer multiples correspond to molecular weights of 223 and 294 kDa, respectively, less than expected and likely the result of extrapolation error (see legend to Figure 3A). The marker bands are 200, 116 and 97 kDa. We determined the relative recovery of protein in each lane by densitometry using ImageJ (50) on a tiff file of the gel image captured by a Qimaging® Micropublisher 5.0 RTV camera. The ‘% in gel’ indicates the percent recovery of total protein in the various bands normalized to the amount recovered as trimer cross linked in 0.5 M NaCl, which we set to 100%. As noted in the text, the distribution of total protein among the various bands depends on the length and concentration of the oligonucleotide. (B) Schematic representation of possible ORF1p species and their cross-linked products generated in the experiments shown in Figures 2 and 3A. The numbers to the left of the cartoons of the cross-linked species indicate their monomer content.

