Figure 3.
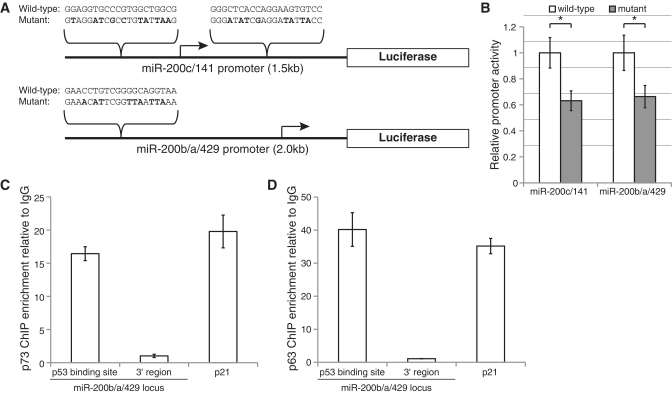
p73 and p63 directly regulate transcription of the miR-200 miRNA families. (A) Schematic of the miR-200c/141 and miR-200b/a/429 promoter fragments cloned upstream of the luciferase gene in the pGL3-Enhancer vector. To generate a mutant version of each promoter, the p53 family consensus binding sites were mutated at the nucleotides shown in bold. (B) Activity of the indicated mutant and wild-type miR–200 promoter constructs transfected into 2008 ovarian carcinoma cells. Promoter activity is expressed relative to the wild-type construct for each promoter, and bars represent the mean relative activity ± SD of four replicates. Asterisk indicates P < 0.003, t-test. (C and D) Chromatin immunoprecipitation of p73 (C) and p63 (D) from 2008 cells. qPCR was used to assess the enrichment of the indicated regions relative to an IgG control chromatin immunoprecipitation. Enrichment of the p53 family binding sites and negative control regions 1 kb 3′ to the miRNAs at the miR–200b/a/429 loci are shown. Enrichment of the p21 promoter served as a positive control. Bars represent mean enrichment ± SD of technical replicates from a representative experiment that was repeated three times.

