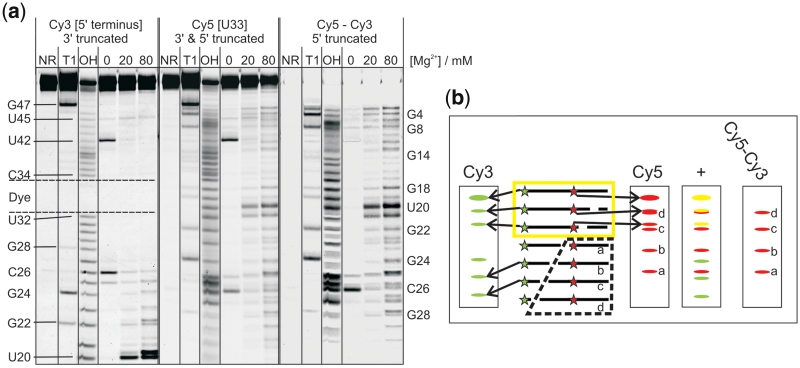
Figure 3.
In-line probing analysis with one terminal and one internal label. (a) In-line probing analysis of a Cy35’-Cy5U33-labelled DAse construct B. The right image is a subtraction of the Cy3 scan from the Cy5 scan after normalization. Selected cleavage bands are annotated on the left (for the Cy3 scan) and on the right (for the subtraction image) of the gel. The position of the internal label is indicated by the dashed lines. (b) Schematic representation of the probing experiment. The panel labelled with Cy5–Cy3 represents a subtraction image with all values <0 set to zero. The yellow box indicates which cleavage products superimpose in both scans (indicated as yellow bands). The dashed box shows the cleavage products visible in the subtraction image.

