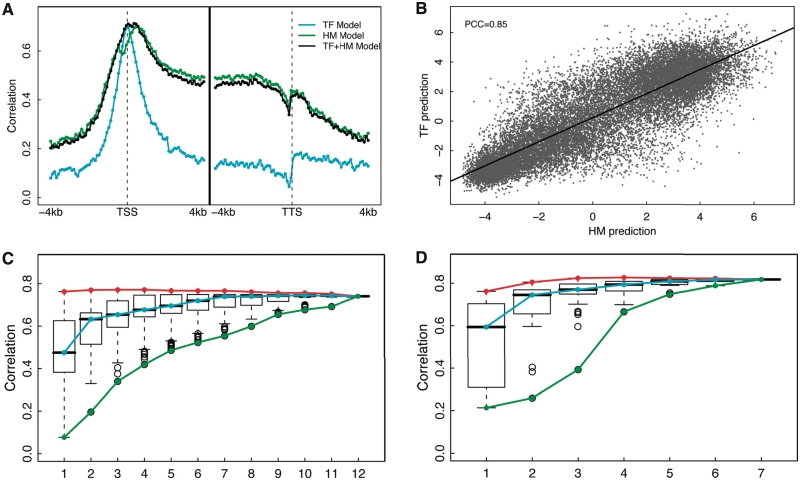
Figure 4.
Redundancy of the TF and the HM models in ESC. (A) The prediction accuracy of three models: the TF model, the HM model and a combined TF+HM model, in each of the 160 bins. (B) Consistency between TF model predictions and HM model predictions. The predicted expression values were based on the two-layer TF model (y-axis) and the two-layer model (x-axis). (C) Distribution of prediction accuracies of all m-TF models with m taken from 1 to 12. (D) Distribution of prediction accuracies of all m-HM models with m taken from 1 to 7. The maximum, the median and the minimum prediction accuracy for m-TF (C) or m-HM (D) models are connected by the red, cyan and green curves, respectively. In (C) and (D), the maximum signals for TF binding or HMs across the 160 bins were used as the predictors.

