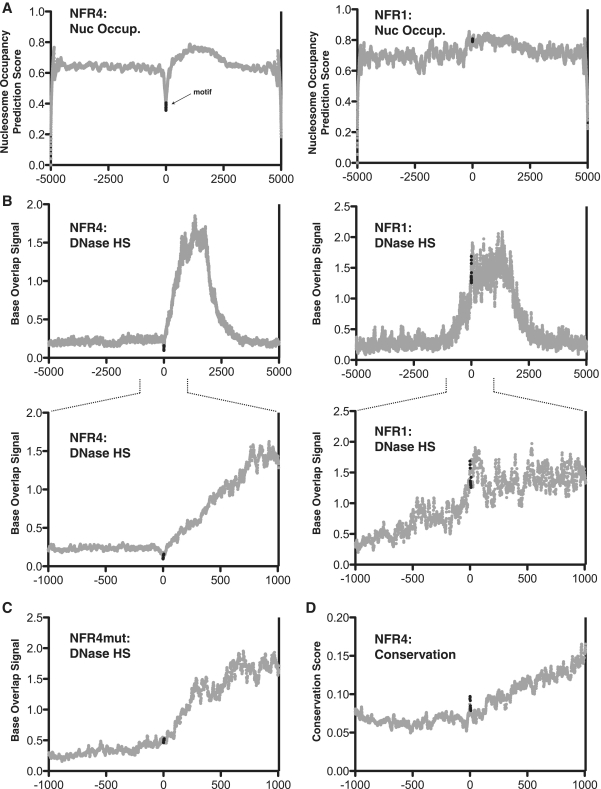
Figure 6.
Genome-wide promoter profile of NFR1 and NFR4. (A) The nucleosome occupancy prediction scores of all human promoters that contain either NFR1 or NFR4 motifs. Y-axis represents the NuPoP nucleosome occupancy score (see ‘Materials and Methods’ section for explanation). The x-axis represents the distance (in base pairs) from the start of the first base of the motif. The data points representing the motifs are shown in black, all other data points in gray. (B) The DNase I-hypersensitivity profiles of all human promoters that contain either NFR1 or NFR4 motifs. Y-axis represents the Base Overlap signal given by raw sequence data from DNase-seq experiments performed with HelaS3 cells. (C) The DNase I-hypersensitivity profile of all human promoters that contain the NFR4mut (mutant) motif. (D) The PhastCons score for the NFR4 motif across all human promoters.

