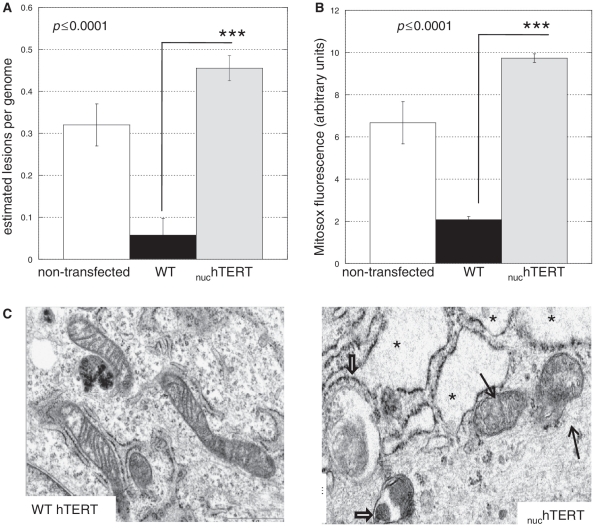
Figure 5.
Lack of hTERT specifically in mitochondria negatively impacts the organelle. (A) MtDNA integrity was measured using QPCR (31–33), and estimated lesion frequency/genome calculated. Results represent the mean of six independent analyses, three in the NHF background and three in the GM7532. Since results were similar the data have been pooled. Error bars represent ± standard error of the mean (SEM). Statistical significance was evaluated using unpaired Student's t-test. (B) Mitochondria superoxide generation was evaluated using the fluorescent probe Mitosox by flow cytometry. Data represent three independent experiments. Statistical significance was evaluated using ANOVA. (C) Non-transfected parental (data not shown), WT- and nuchTERT-expressing cells were evaluated for their subcellular ultrastructures using electron microscopy. At least two independent slides were analyzed per cell type; approximately 20 cells were analyzed per slide. Data shown are representative; criteria to define damaged cellular components are described in the ‘Materials and Methods’ section. Thin black arrows indicate damaged mitochondria and thick black arrows show autophagosomes. The presence of several vacuoles in the cytoplasm is evident in the mutant cells (see asterisks).

