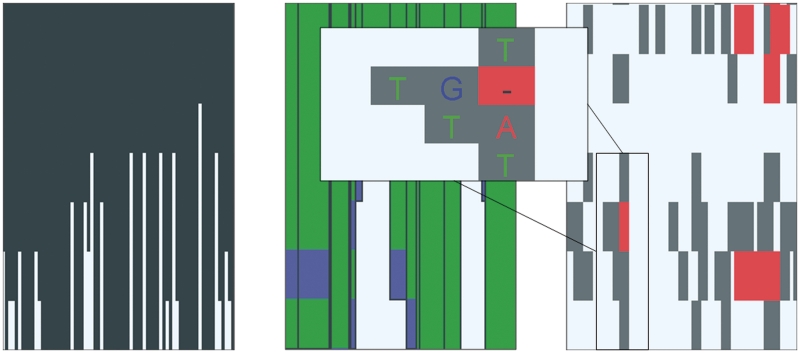
Figure 4.
Overview of the advanced multiple alignment track for large genomes. At a high-level perspective (left panel) the histogram-like plot shows the number of segments that align to the corresponding region in the reference genome. Essentially, this is a conservation plot. When zooming in, more details emerge (center panel). The height of the block is still relative to the number of species that contain that particular alignment block. The colors of the lines in each alignment block indicate the strand used in the alignment. Blue segments are aligned to the reverse strand, while green segments are mapped to the forward strand. When hovering over the block, a pop-up will appear that shows the organism name for each line in the alignment block. Zooming in further will provide more detailed information on the multiple alignments (right panel). At this level, mismatches are indicated with gray blocks and gaps with red blocks. When zooming in even further (inset), the gray blocks will contain the letter of the mismatched nucleotide in the aligned organism.

