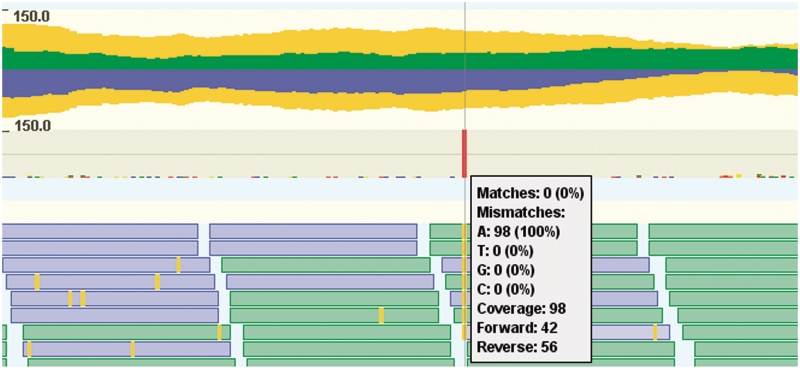
Figure 6.
Overview of the pileup visualization track. This track consists of two parts: the top part is a read coverage plot, while the bottom part shows the consensus sequence summary of individual nucleotides. The read coverage plot consists of three plots, one for the reads mapping to the forward (green, above central axis), one for the reverse strand (blue, belows central axis) and one for the total coverage (yellow, mirrored above and below the central axis). The second part of the pile up track provides a more detailed view that displays a summary of the individual nucleotides as colored bar charts. Centrally in the figure, there is one red bar, indicating a single nucleotide polymorphism (SNP). This is confirmed by hovering the mouse over the pileup track, which gives a textual summary of the coverage and nucleotide frequencies. There are some reads (blue and green boxes) from the short-read track at the bottom of the figure overlapping with the pop-up with detailed information.

