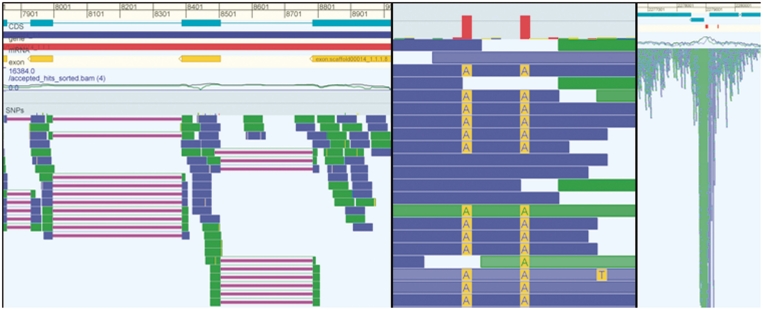
Figure 7.
The three panels in this figure show examples for different data types. The left panel shows a eukaryote genome with RNA-seq data. The reads in this RNA-seq experiment have been aligned with gaps (purple lines) and it is clear that many reads identify/confirm the splice junctions of the annotated CDS (cyan). The middle panel shows data from a resequencing project and shows a detailed view of two SNPs. The right panel shows data from a ChIP-seq experiment and it is obvious that the peak in the mapped sequencing data corresponds to the annotated binding sites (red blocks right above the coverage graph).

