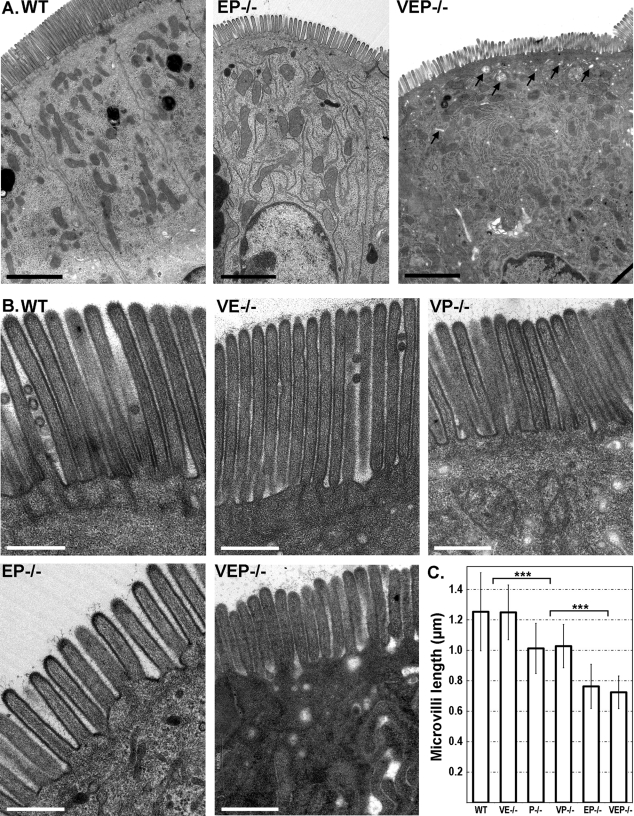
FIGURE 2:
Microvilli still form in the VEP−/− mice. (A) Transmission electron micrographs of sections of jejunum from WT, EP−/−, and VEP−/− presenting a general view of the enterocyte polarity. Arrows point at apical vesicles and vacuoles in the VEP−/− sample. Scale bars: 2 μm. (B) Transmission electron micrographs of sections of jejunum from WT, the three double KO (VE−/−, VP−/−, EP−/−) and the triple KO (VEP−/−) mice illustrating the organization of the brush border. Scale bars: 500 nm. (C) Histograms illustrating the average lengths of the intestinal microvilli depending on the genotype. Values are 1.25 ± 0.26 μm, nWT = 86; 1.01 ± 0.16 μm, nP−/− = 194; 1.03 ± 0.14 μm, nVP−/− = 14; 0.76 ± 0.15 μm, nEP−/− = 75; 0.72 ± 0.11 μm, nVEP−/− = 58. *** t test p < 0.001.

