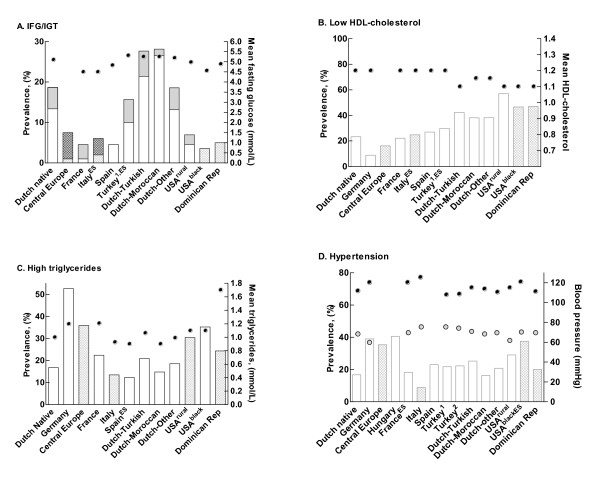
Figure 2.
Prevalence rates of cardiometabolic risk factors according to country. IFG is indicated by light grey bars, IGT by dark grey bars. Blocked bars indicate a cohort with a BMI >30 kg/m2. ESEstimated prevalence from distribution in reference cohort. USArural Cohort from the USA from rural area (both black and white children included). USAblack Cohort from the USA with predominantly black children. IFG-impaired fasting glucose, IGT-impaired glucose tolerance, Dominican Rep-Dominican Republic.

