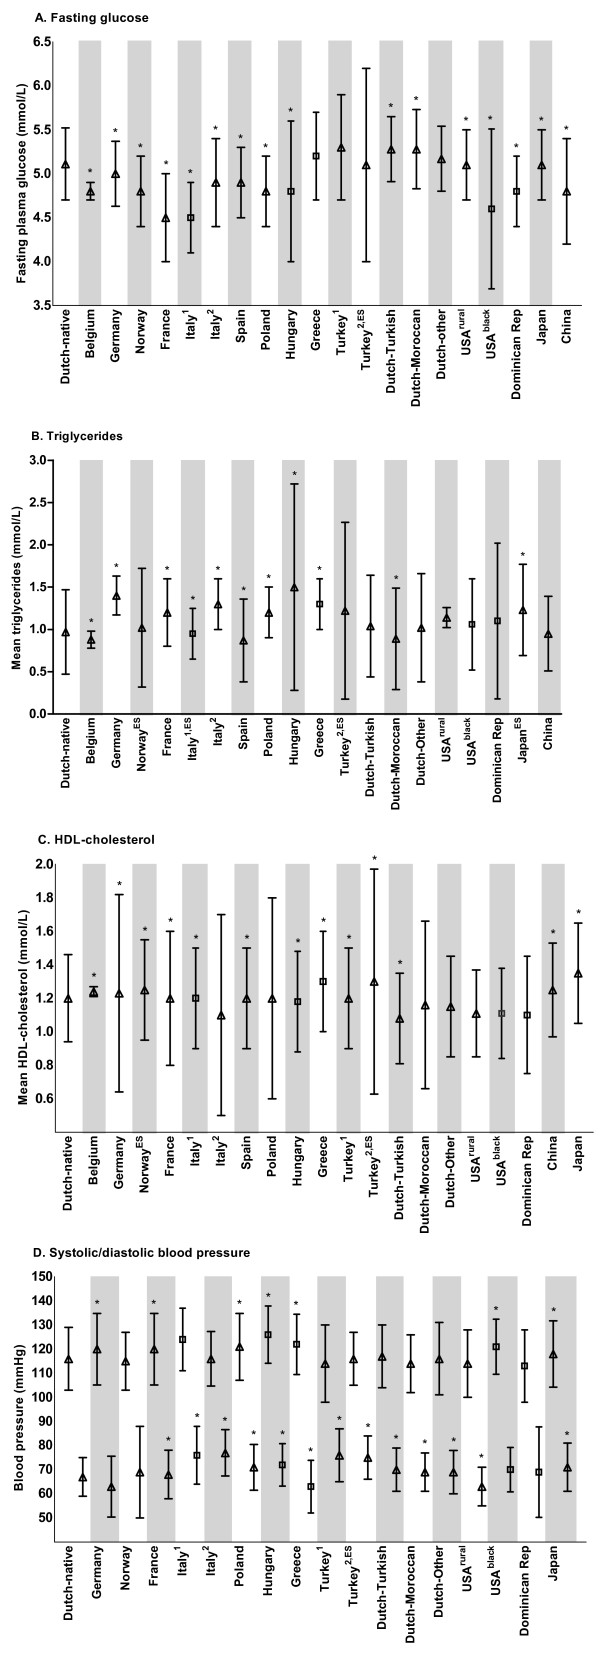
Figure 3.
(continued) Mean values of cardiometabolic risk variables according to country. Data are shown as mean ± SD across countries. Means displayed as a triangle indicate cohorts with a mean BMI between 25 and 30 kg/m2. Means displayed as squares indicate cohorts with a mean BMI>30 kg/m2. For blood pressure, both systolic (upper means and whiskers) and diastolic (lower means and whiskers) are shown. *P<0.05 as compared to Dutch native children. ESMean and SD estimated from median (range or interquartile range). Dominican Rep - Dominican Republic.

