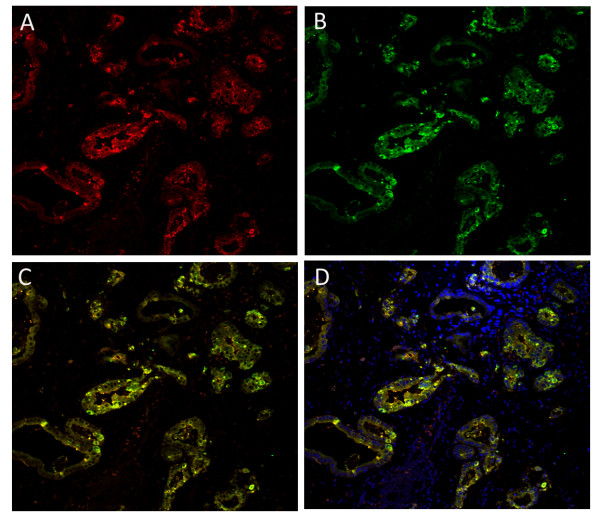
Figure 2.
Co-localization of CEACAM7 and CEA in the tissue of gastric carcinoma (Laser confocal microscopy analysis in a representative section). Positive expression for CEACAM7 (A, red) or CEA (B, green) in the membrane and cytoplasm of cancerous cells (red). C, Merged image without nuclear staining; co-expression of CEACAM7 and CEA is observed (yellow). D, Merged image with nucleus stained by DAPI (blue). (200X).

