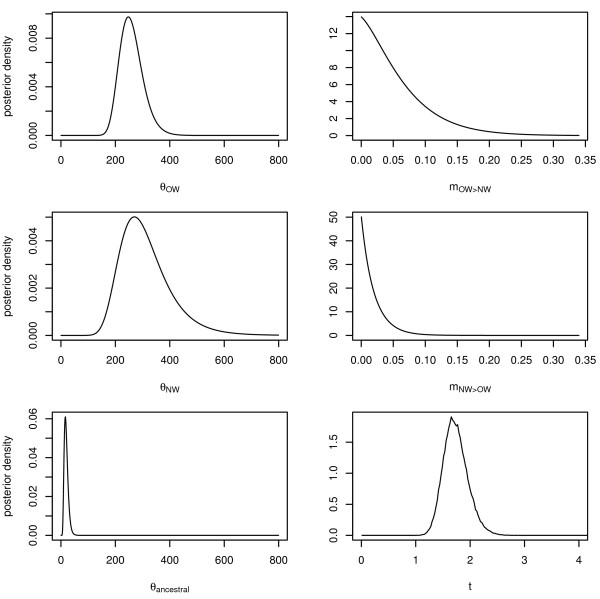
Figure 3.
Density plots of the posterior probability distribution for each of the six estimated demographic parameters. Separate estimates for the effective population size (theta; θ) are given for Old World (OW), New World (NW) and the ancestral population, as well as the splitting time (t). Migration rates from OW into NW (abbreviated as 'mOW→NW') and the opposite direction are also given. Note that all estimates are scaled to mutation rate and not in demographic units; migration rates are displayed in the direction of individual movements (i.e., not in the coalescent notation as presented in the raw output of the IMa2 program).

