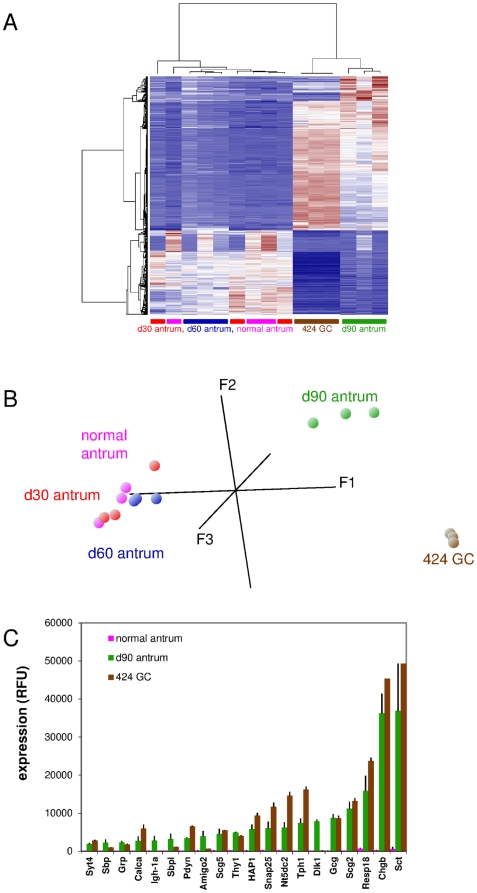
Figure 2. The CEA424-SV40 TAg gastric tumor-derived cell line 424GC transcriptome reflects the neuroendocrine phenotype of the parental tumor.
Transcriptome analysis of RNA from tumor-bearing regions of the antrum from 30- (red), 60- (blue) and 90-day-old mice (green) and d90 non-transgenic mice (pink) as well as from 424GC cells (brown) were performed and the data sets were subjected to hierarchical clustering and principal component analyses (n = 3 for all samples). The heatmap shows that tumors at day 90 and 424GC show the most closely related expression pattern (A). Note that in PCA, data points of 424GC cells and that of d90 antra exhibit coordinates which are substantially different from that of all other samples (B). The expression levels (mean of 3 samples and standard deviation) of selected genes (expression ratio d90 antra/normal antra >15-fold) were compared to that observed for 424GC cells and normal stomach. If a gene was represented by more than one probe set the one which displayed the highest fold change value (expression d90 versus normal antra) was chosen (C). Note high expression of genes characteristic for the neuroendocrine lineage in both d90 antra and 424GC cells (e.g. tryptophan hydroxylase, Tph1; chromogranin B, Chgb; secretin, Sct).

