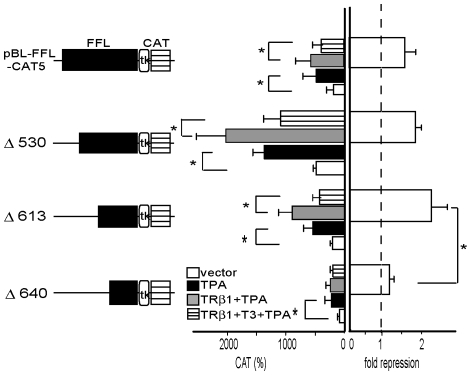
Figure 4. Deletion analysis of FFL cDNA as a transcriptional regulatory sequence.
Schematic representation of deletion mutants of pBL-FFL-CAT5 is illustrated in the left panel. Fold repression (right panel) was calculated from CAT activity without T3 divided by that with T3. In the deletion mutant Δ640, basal activity was reduced. Although TPA treatment modestly but significantly potentiated the promoter activity, repression by T3/TR was blunted (middle and right panels). CAT activity was measured with normalization of the transfection efficiency by β-galactosidase activity. The results are the means +/− SD from three independent experiments. *, P<0.05.

