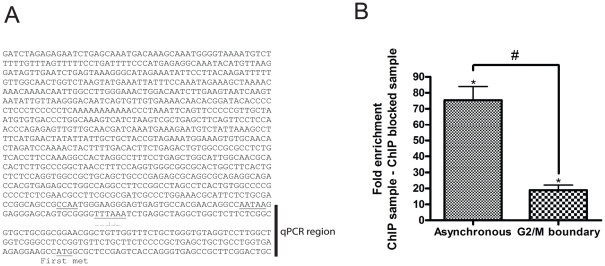
Figure 4. STOX1A binds to the 5′ upstream regulatory region of the CCNB1 gene.
(A) The DNA sequence previously characterized as the 5′ upstream regulatory region of the CCNB1 gene [24], [25] indicating the fragment used for quantitative PCR. (B) Chromatin immunoprecipitation was performed with asynchronized STOX1A stably transfected cells in parallel with STOX1A stably transfected cells synchronized at the G2/M phase boundary. Significantly higher enrichment for the 5′ upstream regulatory region of the CCNB1 gene was found in asynchronized cells compared to cells synchronized at the G2/M-phase boundary (left vs right bar). Bars are mean ± SEM, P-values were calculated using two-tailed unpaired t-test. # indicates P<0.001. (B, left bar). Quantitative PCR results show a mean 75 fold (mean ΔΔCt is −6.23) enrichment for the 5′ upstream regulatory region of the CCNB1 gene in STOX1A stimulated ChIP DNA, compared to their negative controls (ChIP sample vs ChIP negative sample) obtained from asynchronized STOX1A stably transfected SH-SY5Y cells. (B, right bar) Results show a mean fold 18 (mean ΔΔCt is −4,18), enrichment for the 5′ upstream regulatory region of the CCNB1 gene in STOX1A stimulated ChIP DNA, compared to their negative controls (ChIP sample vs ChIP negative sample) obtained from STOX1A stably transfected SH-SY5Y cells synchronized at the G2/M-phase boundary. Bars are mean ± SEM. Asterisks indicate P<0.05 (one sample t-test with theoretical mean 0).

