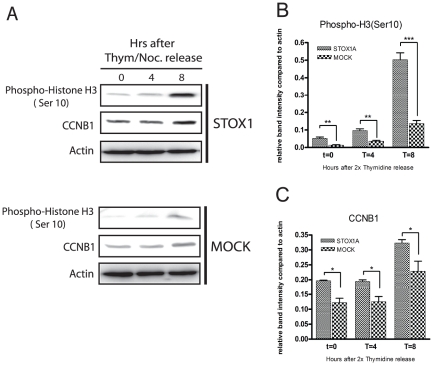
Figure 5. Direct upregulation of CCNB1 effectuates enhanced mitotic entry.
(A) Stably transfected STOX1A and MOCK SH-SY5Y cells were synchronized in the S-phase and total cell extracts were prepared from 0, 4 and 8 h after release from the 2× thymidine block. Western blotting was performed using antibodies to Phospho-Histone H3 (Ser 10) and CCNB1. An antibody specific for actin was used as a loading control. Westernblot image is a representative of at least 3 independent experiments. (B) Westernblot (see 5A) quantification of Phospho-H3 (ser 10) was performed using densitometry. The ratio number of obtained band intensities for STOX1A divided by actin was compared to the ratio number of obtained band intensities for MOCK divided by actin for 3 independent experiments. A significant increase for the STOX1A ratio number was found at all time points compared to the MOCK ratio number. (C) Westernblot (see 5A) quantification of CCNB1 was performed using densitometry. The ratio number of obtained band intensities for STOX1A divided by actin was compared to the ratio number of obtained band intensities for MOCK divided by actin for 3 independent experiments. A significant increase for the STOX1A ratio number was found at all time points compared to the MOCK ratio number. P-values were calculated using two-tailed unpaired t-test, error bars represent ± SEM, * indicate P<0.05, ** indicate P<0.01, *** indicate P<0.001.

