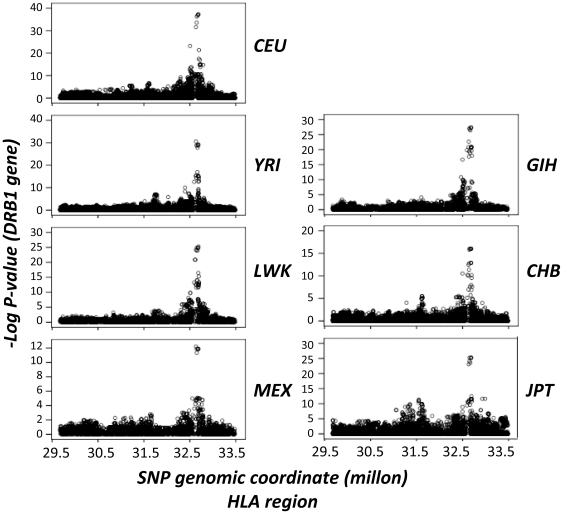
Figure 1. Association of HapMap III SNPs from the HLA region with expression levels of the HLA DRB1 gene.
The figure shows the strength of association between SNPs and gene expression levels, plotted as −log P-values. Coordinates are in NCBI Build 36. Shown are the CEU, YRI, LWK, MEX, GHI, CHB and JPT HapMap populations [26].

