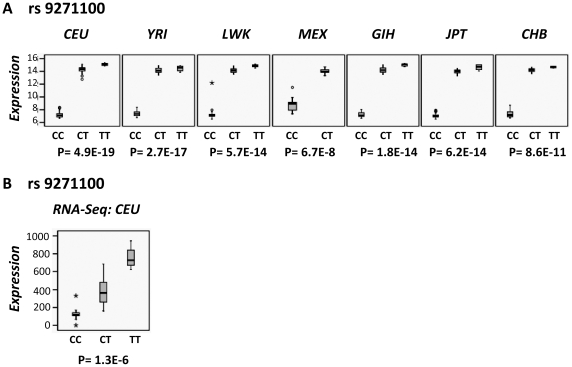
Figure 3. Association of the MS-risk variant rs9271100 with DRB1 gene expression levels.
In all plots, expression levels are represented for the three genotype groups. (A) Box plots of expression data from normalized results of ILMN_1715169 (DRB1) probe generated by Illumina Human-6 v2 Expression BeadChip (EMBL-EBI database (http://www.ebi.ac.uk/arrayexpress/) ID projects E-MTAB-198). (B) Box plot of expression data from the NM_002124 (DRB1) transcript of 41 CEU individuals obtained from RNA-Seq [19]. P-values are calculated by Kruskal Wallis Test.

