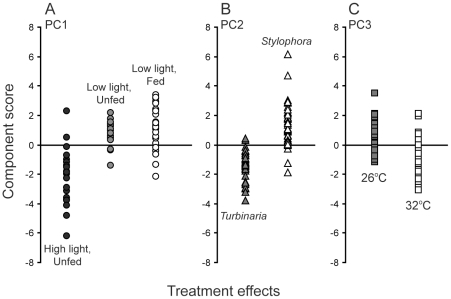
Figure 4. Component scores from Principal Components Analysis of photophysiology data.
Points show scores for individual coral colonies and indicate experiment, species and temperature dependence of scores on the first three principal components respectively (PC1, PC2 and PC3). Summary statistics are provided in Table 3.

