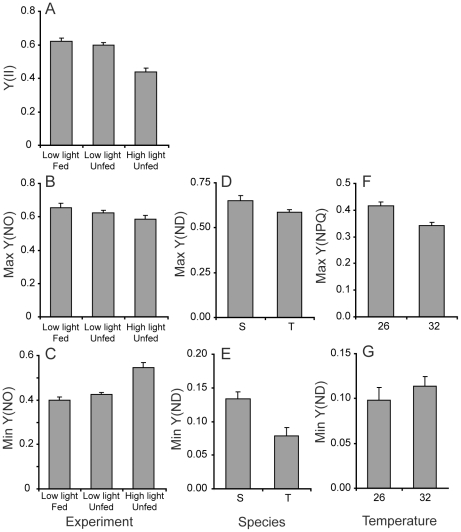
Figure 5. Variation in photophysiology parameters identified through principal components analysis as having a strong effect on overall photochemistry.
Data for each variable are pooled and plotted according to the effect identified for the principal component with which they were strongly associated (Fig 4, Table 3). For example, Y(ND) was strongly related to PC2 which differentiated between the study species Turbinaria reniformis (T) and Stylophora pistillata (S). 26 and 32 denote the two different incubation temperatures of 26°C and 32°C. Bars show means and standard errors.

