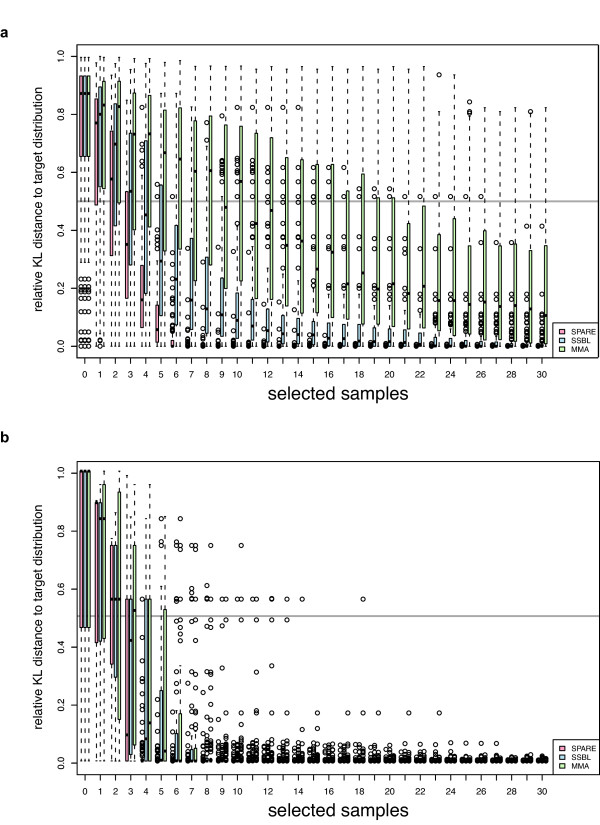
Figure 1.
Benchmarking of SPARE, SSBL and MMA on the strong linkage (a) and on the unbalanced allele scenario (b). The posterior distribution obtained when phenotyping all available individuals is considered as the target distribution. The relative Kullback-Leibler distance (KL distance, Equation 6) to target distribution (y-axis) is the KL distance of a given posterior distribution to the target distribution divided by the KL distance of the initial posterior distribution (parental strains only) to the target distribution. Each boxplot summarizes the performance of 100 simulation runs for SPARE (pink), SSBL (blue) and MMA (green). Boxplots are grouped by selection sample size and selection method.

