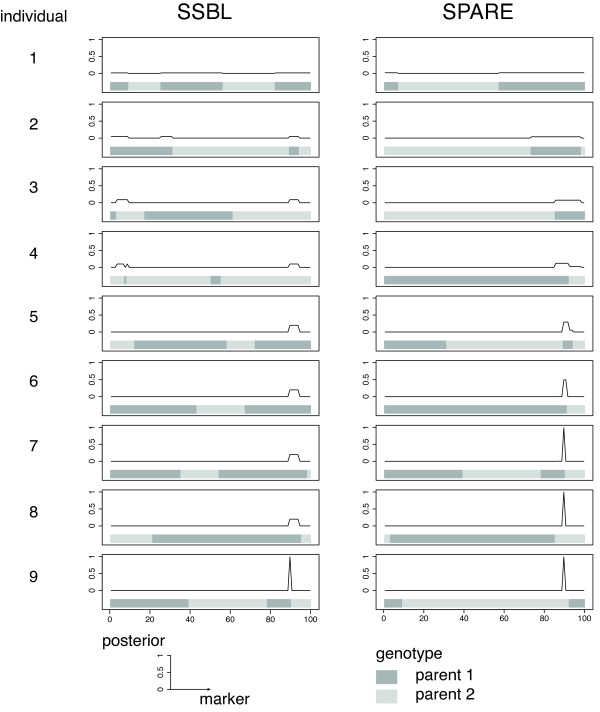
Figure 3.
Comparison of SSBL and SPARE for incremental phenotyping. The first 9 selected individuals of SBBL (left) and SPARE (right) for one run of the strong linkage simulation scenario. Selected individuals are phenotyped one after the other sequentially (from top to bottom). The horizontal bars show the genotype of each individual along the 100 markers (dark grey genotype of parent 1, light grey genotype of parent 2). The updated posterior probability after phenotyping the selected individual is displayed above. SPARE, which can make use of previous phenotypes, selects individuals with crossovers lying in the current QTL interval, thereby narrowing it down faster to a single marker.

