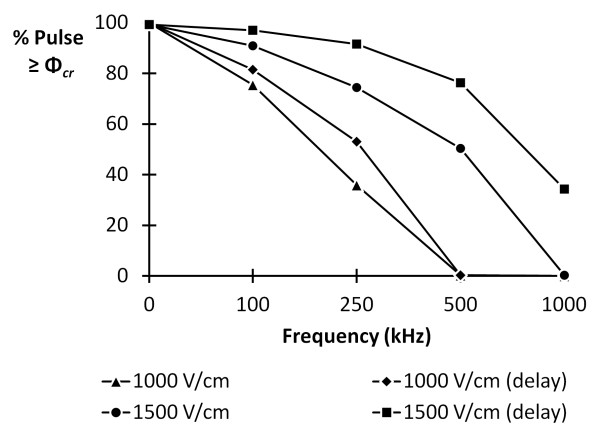
Figure 3.
Comparison of time above the critical threshold (Φcr) for IRE at various center frequencies. Bipolar bursts were simulated with an electric field of 1000 V/cm and 1500 V/cm and an on-time of 20 μs. As the frequency of the applied field is increased, the time above the critical threshold diminishes. This characteristic dispersion is shifted towards higher frequencies for bursts that have a delay between the positive and negative polarity pulses. A conventional IRE pulse is depicted by the 0 kHz data point.

