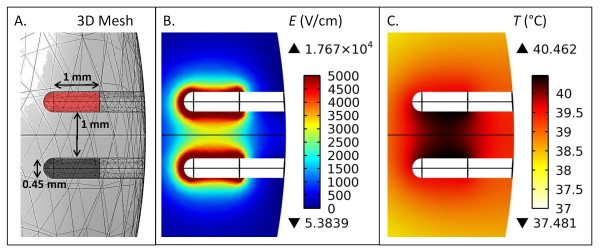
Figure 4.
Schematic diagram of the FEM alongside the predicted electric field (E) and temperature (T) distributions in brain tissue. The 3D mesh (A) consisted of 23989 elements. An energized electrode (red) and ground electrode (black) with a 0.45 mm diameter were spaced 1 mm apart (edge-to-edge) and had an exposure length of 1 mm (not including the blunt tip). (B) The resulting electric field distribution in the x-z plane for an applied voltage of 400 V along the energized electrode. (C) The resulting temperature distribution in the x-z plane following the simulation of 180, 200 μs pulses. Upper and lower triangles in the legends depict maximums and minimums within the entire subdomain, respectively.

