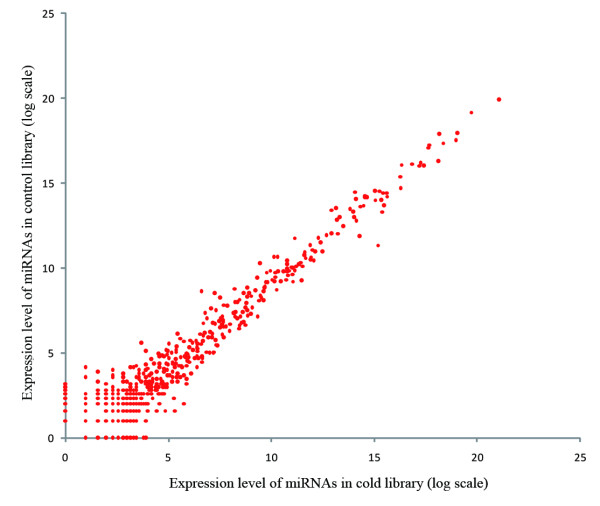
Figure 3.
Scatter plot showing the miRNA expression levels of the zebrafish cold and normal brain libraries. The plot indicates much more expression noise of lowly expressed miRNAs than that of highly expressed ones. Hence, to define biologically significant miRNAs, we screened the differential genes from those with mean expression level greater than 64.

