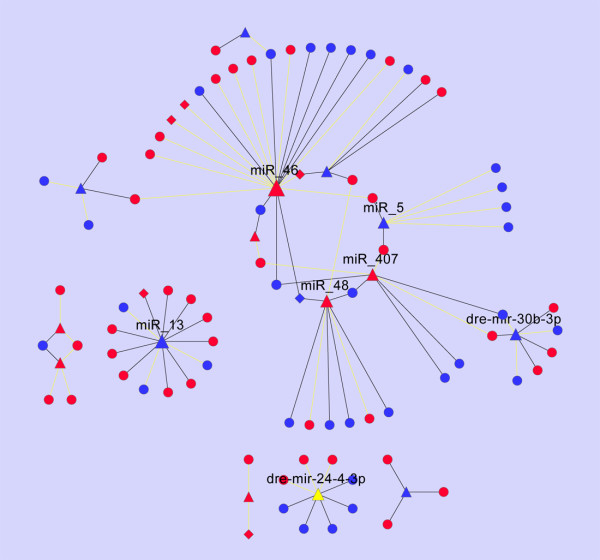
Figure 6.
Graphic illustration of the regulatory relationship between the differential miRNAs and mRNAs predicted by PITA. Triangles, circles and diamonds denote miRNAs, non-TF genes and TF genes, respectively. The nodes in red and blue denote up- and down-regulated miRNAs or mRNAs, respectively. The edges in dark and yellow denote coherent and incoherent regulation, respectively. The size of a node is proportional to the number of its partners. Of nodes with degree > 5, the associated name is shown.

