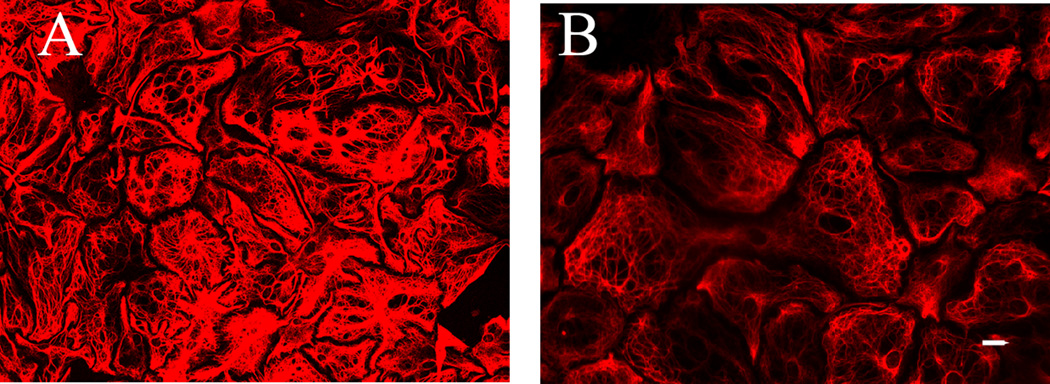
Fig. 3.
Decreases in GFAP / Cy3 thresholded signal are due to a decrease in the intensity and not due to a change in astrocytic morphology. Micrographs from a control (A) and a CEE dish of co-cultured CGCs and astrocytes (26 DIV) Day 5 time point (B) taken from the same culture batch. Note that the shape of the CEE-treated glia cell does not differ from control (no drug treatment) astrocytes and this morphology is much different from the latrunculin A-treated cells reported in Fig. 1 (B). Micrographs were acquired with a confocal microscope; scale bar at 20 µm.

