
Figure 1.
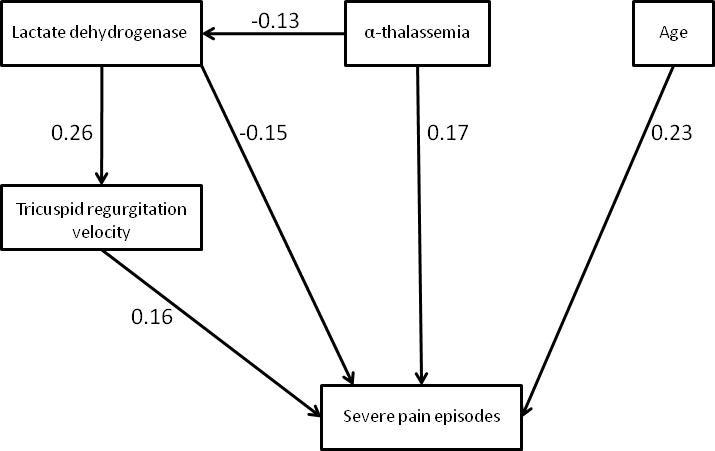
Pathway analysis of pain episode frequency in children with sickle cell anemia. Model was adequately fitted to data with root mean square error approximation (RMSEA) =0.01 (90% CI=0.0–0.08). Model chi-square is 4.2 (P=0.4, Degree of freedom = 4). Standardized beta are shown in the figure. All p values are < 0.04. A similar pathway in which severe pain was a predictor of higher tricuspid regurgitation velocity was not significantly different from this pathway as a result the direction of causation between pain and TRV could not be differentiated by this analysis.