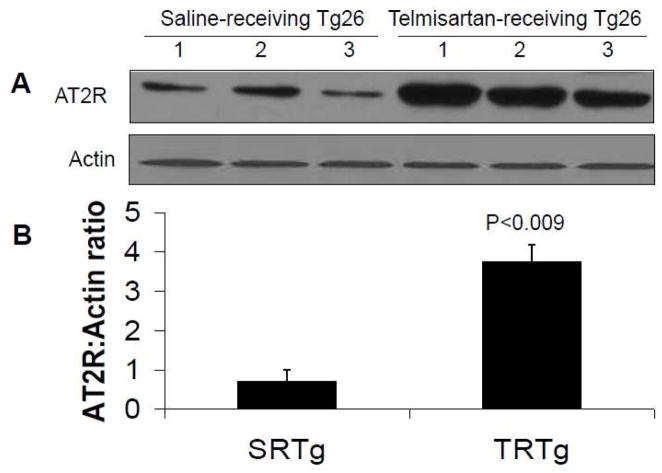
Fig. 7. Immunoblotting studies display enhanced renal tissue AT2R expression in TRTgs.
Proteins were extracted from renal tissues of SRTgs (n=3) and TRTgs (n=3), Western blots were prepared and probed for AT2R.
A. The upper lane represent renal tissue expression of AT2R from SRTgs and TRTgs in tiplicates. The lower panel represent actin content in each variable under the similar conditions.
B. Cumulative data in the form of bar diagram showing AT2R expression by SRTgs and TRTgs.

