
Fig. 4.
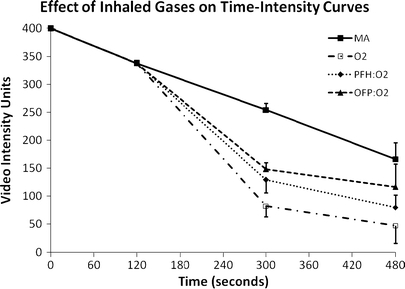
Theoretical time-intensity curves constructed by starting from an arbitrary 400 video-intensity units and applying the mean slope associated with MA-baseline, each gas used in period 2, and the slope during MA-post following each of the four gases. The error bar reflects the error calculated based on the SEM for each of the three periods for each gas. Since the slopes during MA-baseline for each gas were not statistically different, the mean MA-baseline slope and SEM for all injections were used for clarity. Note that when MA was used in period 2, the decay curve throughout all three observation periods is nearly linear. The decay rate in period three while the animals are breathing MA following the use of gases other than MA in period 2, slows by 2.6 times (p = 0.0003).