
Fig. 5.
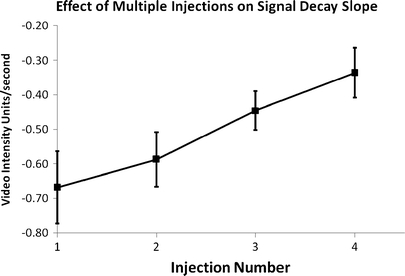
Slope of signal decay ± SEM while the animal is breathing MA immediately following contrast administration in period 1 prior to switching the gas. The slope is plotted against the injection order of four consecutive injections. Note that the signal is lost at a slower rate, with subsequent injections doubling microbubble survival by the fourth injection.