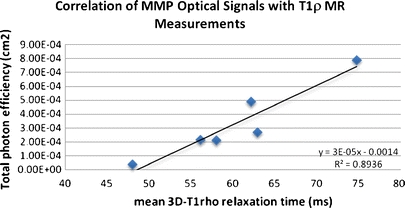
Fig. 4.

The MMP optical signal was plotted against the MR T 1ρ measurement. Six different samples were used. A linear regression model showing an increase of MMP optical signal with T 1ρ measurement with R 2 at 0.8936. The corresponding P value was calculated at 0.0044, indicating a significant relationship of the optical and MR measurements.
