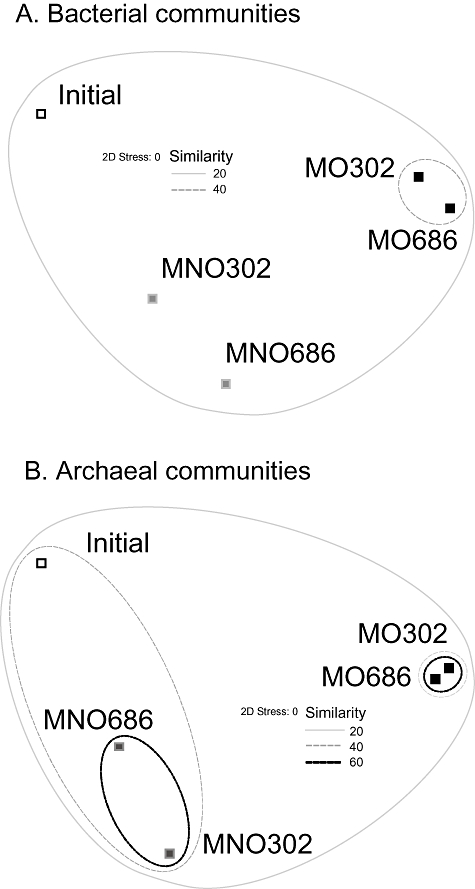
Fig. 4.

Non-metric MDS analysis of the bacterial and archaeal communities present in the River Tyne sediment at the start of the incubation period (Initial) and after 302 and 686 days based on OTU frequencies in 16S rRNA gene clone libraries. MDS plots are representations of how different the communities are from each other based on clustering of like samples. Similarity contour lines from cluster analyses are superimposed on to the MDS plots; however, only contours encompassing more than one clone library profile are shown. The MO302 and MO686 symbols indicate the oil amended microcosms and MNO302 and MNO686 symbols indicate the unamended microcosms.
