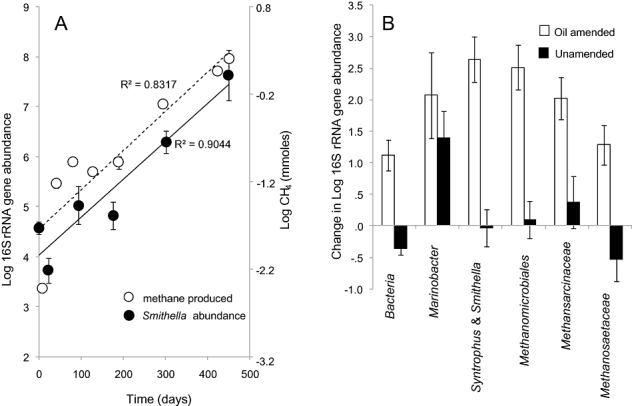
Fig. 6.

A. Smithella/Syntrophus 16S rRNA gene abundances (log gene abundance/cm3) (closed circles) and log methane produced (open circles) in the oil degrading microcosms from 0 to 450 days. B. Average differences in 16S rRNA gene abundance (log gene abundance/cm3) between the lag phase (0–176 days) and the period of highest methane production (176–450 days) for the taxonomic groups targeted by qPCR assays. A value of zero indicates no change, a positive value indicates an increase in abundance and a negative value a decrease. Error bars represent 1 × SE.
