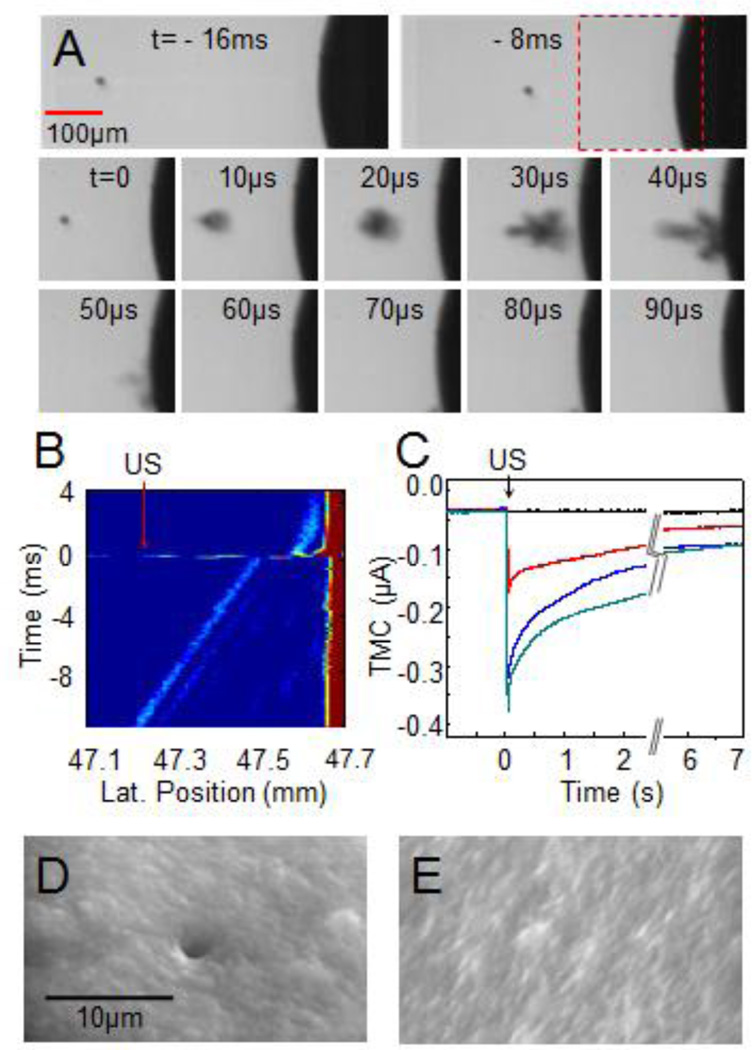
Figure 2.
Controlled cavitation of a single bubble increased the cell membrane permeability. (A) Optical images showing the process of a microbubble (radius 10 µm) being pushed toward the cell by the 7.44 MHz pulses. A 1.5 MHz ultrasound (duration of 40 µs) induced collapse of the bubble. (B) The 7.44 MHz M-mode ultrasound image shows the bubble movement and collapse. The 1.5MHz ultrasound was turned on at t = 0. The horizontal axis represents the distance (mm) from the transducer surface to the bubble. (C) Typical examples of inward TMC during sonoporation generated by 1.5MHz tone burst with a duration of 13.3 µs (red) or 40 µs (blue) at 1.5 MPa, and duration of 13.3 µs at 1.7 MPa (green). (D) An SEM image showing a pore that was generated on a cell by cavitation of a single bubble in calcium-free ND 96 solution. (E) An example of SEM image of the membrane without pores for the control groups.

