Figure 5.
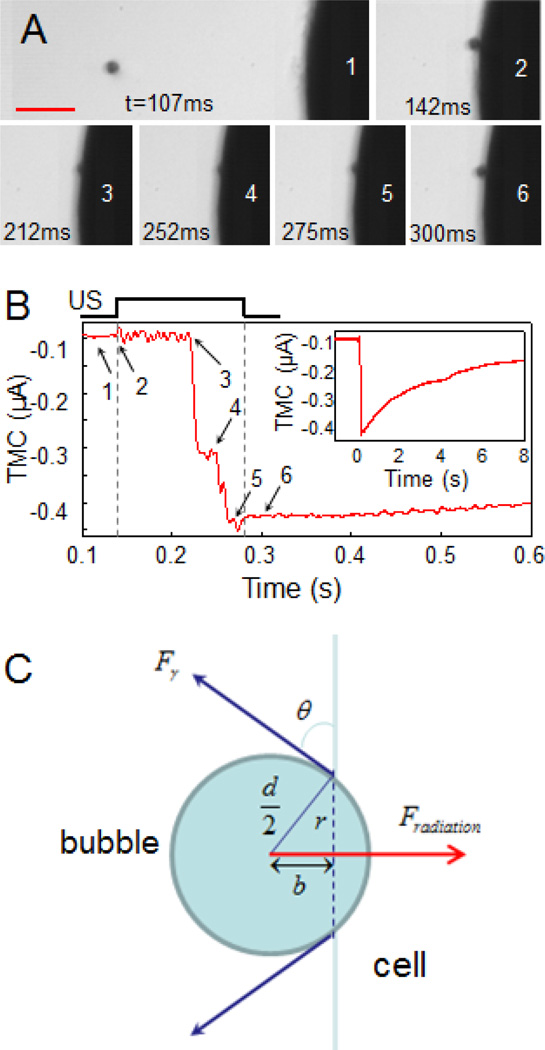
Increase of cell membrane permeability by microbubble compression on the cell membrane. (A) Time-resolved optical images of a bubble moving toward the membrane by the 7 MHz pulses (PRF 10KHz, spatial, temporal peak negative pressure 1.4 MPa) and then pushed against the membrane by a 1.5MHz ultrasound tone burst (duration 133 ms, peak negative pressure 0.27 MPa). The 1.5 MHz ultrasound pulse was on from frame 2–5, and off on frame 6. The scale bar is 100 µm. (B) The TMC of the cell in voltage clamp affected by the ultrasound-driven bubble in (A). The numbers 1 to 6 were time points corresponding to the labeled frames in the optical images in (A). Inset: The recorded TMC showed the recovery of the current in about 8 s. (C) The force balance relation of the acoustic radiation force and the membrane tension on the bubble.

